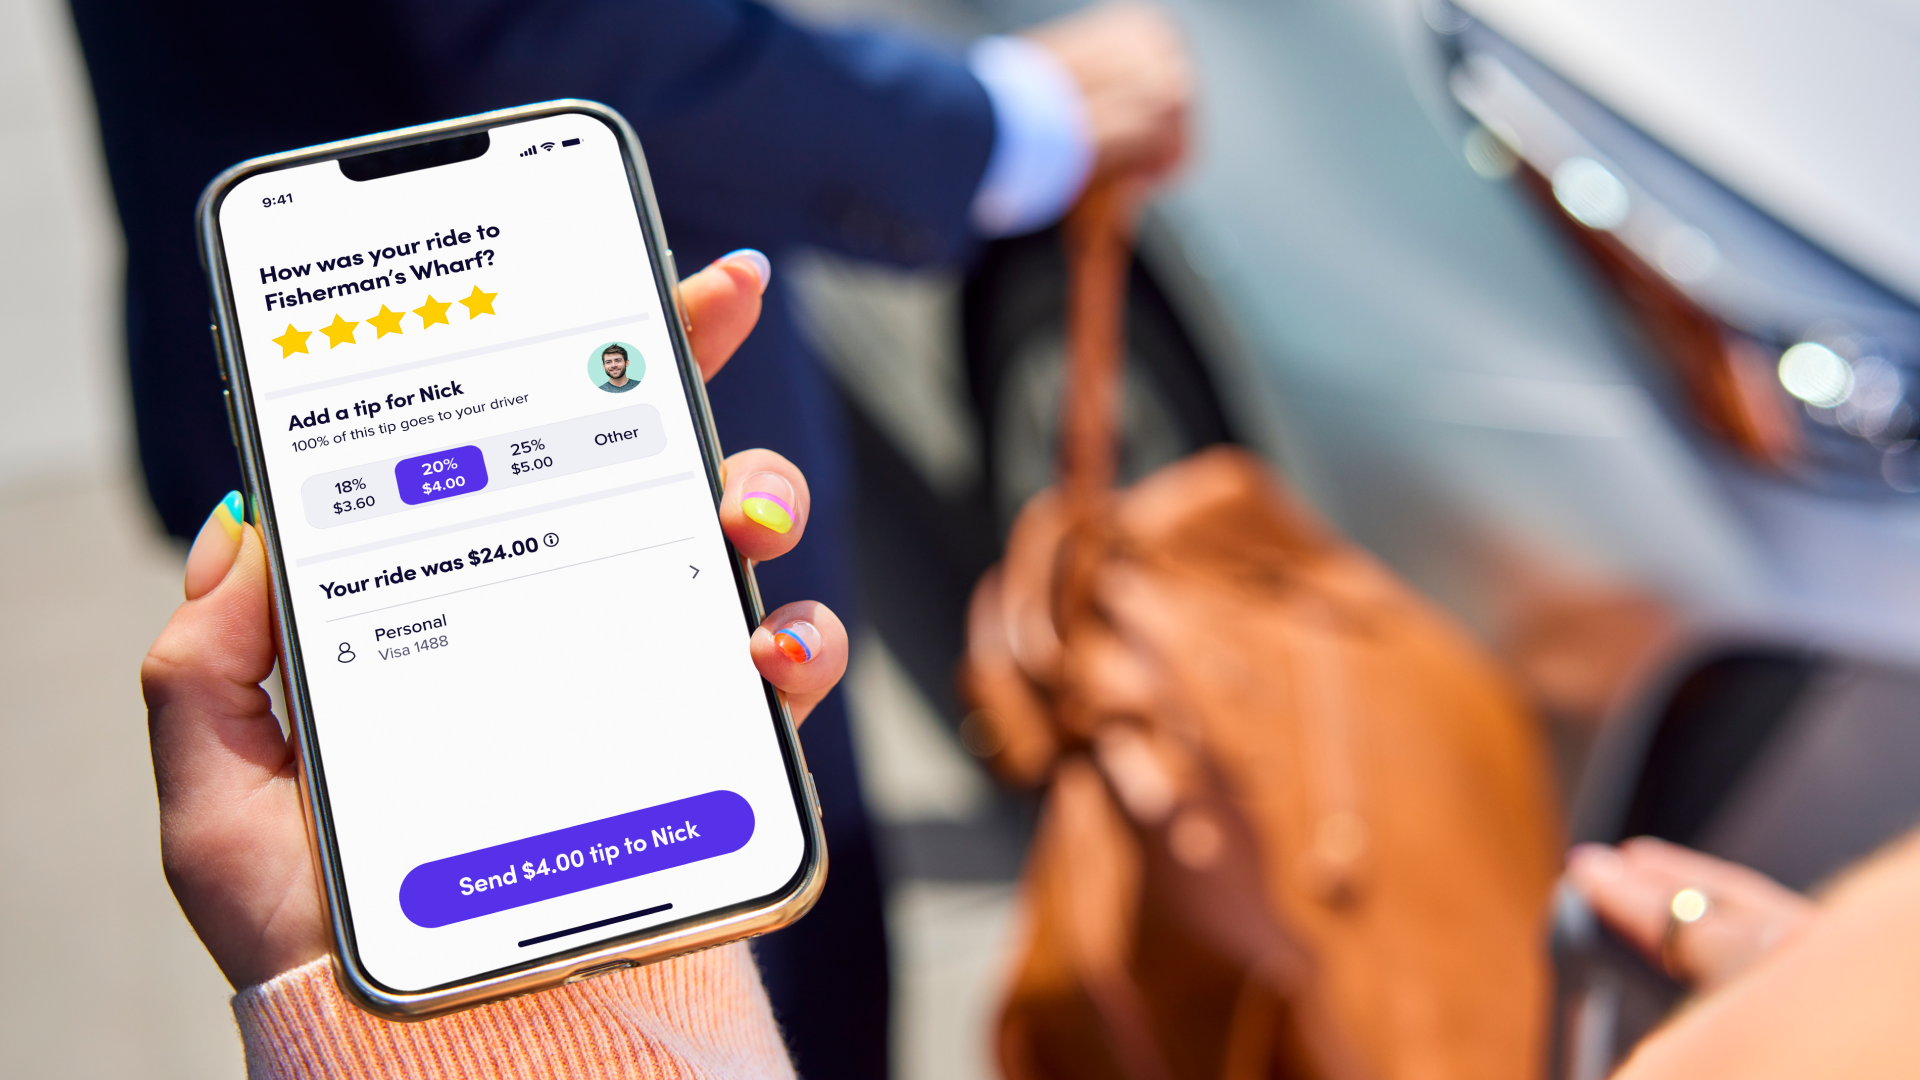
The United States may be the most tip-happy country in the world. It’s become an integral part of our culture and our economy. But it’s also a bit of a mystery. Tipping rates vary by state, by time of day, and by activity. If only there was data that could shed some light on tipping behavior across the country! Good news: There is — at least for rideshare. Over seven years and millions of rides, Lyft has gained tons of insights into where and when people tip. Here is a detailed look at the United States of Tipping.
Which states have the best tippers?

What do Montana and Wyoming have in common with Vermont, New Mexico, Alaska, and Hawaii? A high frequency of scenic outlooks? A low number of alligators per capita? Perhaps! But according to Lyft data, these six states are also home to some of the best tippers. The map above plots the percentage of rides that include tips for each state. Bright red is reserved for states with the most tippers (again, Montana, Wyoming, Vermont), orange for states with relatively frequent tippers (Maine, Oregon, and the Dakotas), and faint yellow indicates the states that tip least frequently.
What can account for these discrepancies? The most compelling explanation could be the presence or absence of a significant metropolitan area.
The figure below plots state-level tipping trends against FiveThirtyEight’s urbanization index, which measures population density. The result is clear: The more rural the state, the more likely a rider is to tip.

Which begs the questions, what about urban areas? In which cities do the best tippers reside? As shown in the bar chart below, Las Vegas had the most generous riders, closely followed by Denver. In both cities, riders were twice as likely to tip than other urbanites, on average.

When are riders most likely to tip?
While tipping fluctuates throughout the week, it spikes on the weekends — in particular Friday and Saturday nights. Tips also spike around the hours of 12 p.m. and 6 p.m. each day: rides that occur around lunch and dinner.
Meanwhile, tips are lowest on Mondays and Tuesdays, as well as at 6 a.m., when riders are more likely to be heading to work.
And there is a notable bump around 4 a.m., which might include riders going to the airport or, just maybe, riders who found post-last-call solace in conversation with their driver.
What kind of trips get the most tips?

Tipping tendencies also vary depending on where riders are going, as the bar plot below shows. Unsurprisingly, routine trips (to offices, schools, and residential areas) don’t garner as many tips as more discretionary trips for pleasure (i.e., food, entertainment, and travel). In fact, riders are about twice as likely to tip on rides to lodging like hotels than to their own homes.

So it shouldn’t be too surprising that tourists tip more frequently than locals. It turns out that riders are about twice as likely to tip when they are outside their home region. A similar ratio applies to airport rides: Pickups and dropoffs at the airport resulted in twice as many tips as non-airport trips.

The Taylor Swift Effect
There’s one more group of passengers that tends to be particularly generous when it comes to tipping: Taylor Swift fans.
This is a graph of the average tip amount in the New York metropolitan area over the month of May. As you can see, there’s a spike over the May 27 to May 29 weekend.

It turns out that during that time, an unusually large number of rides were taken to MetLife Stadium, where Swift was having three sold-out concerts as part of her Eras tour. And it also turns out that a tip for the average Swift ride was almost three times higher than the average New York–area ride. In other words, Swift concertgoers were so generous that they accounted for a noticeable uptick in tipping in the New York metropolitan area. Go Swifties!

And it’s not just New York. Swift’s fans are routinely generous tippers. The table below shows the ratio of the average tip for a Swift ride vs. non-Swift ride in cities around the country. As you can see, drivers got around three times as much in tips when they were driving to an Eras concert. (And in Atlanta, it’s almost five times as much.)
But Taylor Swift’s Eras tour has not yet come to an end. The crown for the city with the most generous Swifties remains unclaimed. Who will win?


